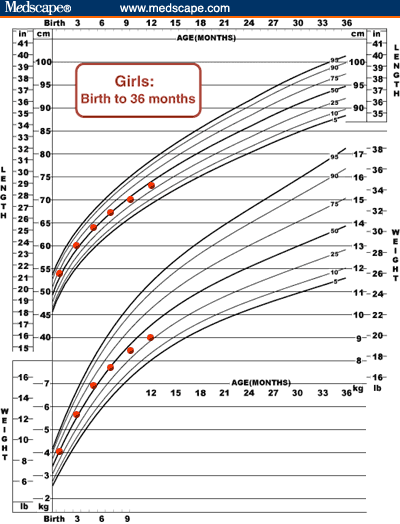
The red points plotted on the CDC Growth Chart below (Figure 9) were derived from a World Health Organization (WHO) data set of exclusively breast-fed girls measured at 1, 3, 5, 7, 9, and 12 months of age and represent their mean length-for-age and weight-for-age.[31] When these measurements were plotted on the new CDC growth charts birth to 36 months, length-for-age remains fairly stable throughout the first year of life. Weight-for-age plots slightly above the 50th percentile until between 3 and 5 month of age when it begins, and continues to decline throughout the first year of life.
CDC is collaborating with WHO to develop a set of international growth charts for infants and children through 5 years of age based on the growth of predominantly breast-fed infants. Data collection is currently under way.
Figure 9.